Emergency Response Measures in Canada: Platforms That Track Them, From COVID-19 to Today’s Crises
When COVID-19 hit in 2020, a lot of us went looking for local information we had never needed before. Which services had closed. Whether our city had declared a state of emergency. What help there was for a laid-off neighbour or a struggling corner store. One of the tools we leaned on was CityWatch Canada, which posted daily updates on what municipalities across the country were doing.
That pandemic chapter is behind us, but the bigger question CityWatch raised has not gone anywhere: how do you keep track of the way Canada responds to an emergency? As wildfires, floods, and heat waves become a yearly story, that question matters more than ever. We follow this topic closely, so we pulled together the platforms doing that work today, grouped by type of crisis, and for each we share who runs it, what it shows, and whether it is still active. We close with a look back at the COVID-era tools, CityWatch included, that got us interested in the first place.

The numbers behind the worry
One pandemic has given way to a rotating set of hazards. These figures show the scale of what Canadian platforms now monitor.
8.9M ha
burned in 2025, Canada’s second-worst wildfire season on record
85,000
people evacuated during the 2025 wildfire season
619
lives lost in BC’s 2021 heat dome, still Canada’s deadliest weather event
49.6°C
national heat record, set in Lytton, BC
855
emergency alerts sent through Alert Ready in 2024
4.65M
COVID-19 cases recorded across Canada
Behind every one of these numbers sits the same practical question: where do you go for reliable, current information, and what should you do with it?
A quick note on method. Every platform below was checked in June 2026, and the status labels reflect whether the site was live and updating at that time. Figures come from the operators themselves and from federal sources such as Statistics Canada, Natural Resources Canada, and Environment and Climate Change Canada.
Wildfire and smoke
Wildfire has the most developed monitoring of any hazard in Canada, built up over decades and stress-tested hard since 2023.
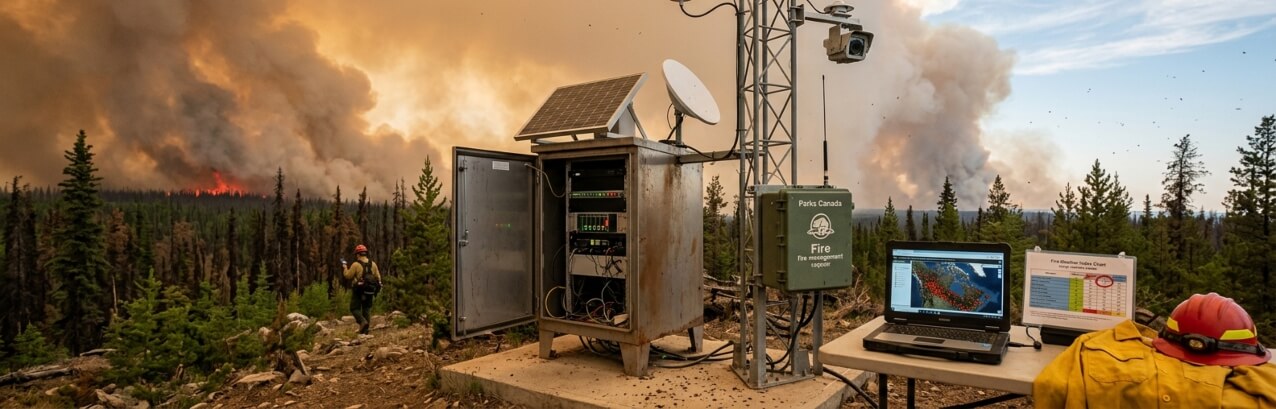
Canadian Wildland Fire Information System (CWFIS)
Run by Natural Resources Canada · National dashboard · Country-wide
CWFIS has produced daily national fire maps since 1994, pulling from more than 2,500 weather stations and satellite detection. Its interactive map layers active fires, fire weather, and danger ratings, so you can see both where fires are burning and where conditions are ripe for new ones.
● Active
Canadian Interagency Forest Fire Centre (CIFFC)
Run by CIFFC · Coordination + statistics · Country-wide
CIFFC moves firefighting crews and equipment between provinces and territories when one region runs short. It also publishes national situation reports and a live statistics dashboard, the cleanest place to find fires to date, area burned, and how the season compares to the ten-year average.
● Active
FireSmoke Canada
Run by the University of British Columbia · Smoke forecast · North America
FireSmoke predicts where wildfire smoke will drift over the next three days. It is the tool to check when the nearest fire is hundreds of kilometres away but the sky over your city has turned orange.
● Active
FireWork air quality forecast
Run by Environment and Climate Change Canada · Air quality model · North America
ECCC’s FireWork system models how smoke and fine particulate matter spread across the continent over a 72-hour window. It feeds the smoke forecasts you see on weather.gc.ca and the WeatherCan app.
● Active
Air quality
Smoke turned air quality into a national health story in 2023, and the warning tools grew to match.
Air Quality Health Index (AQHI)
Run by Environment and Climate Change Canada · Health index + alerts · Country-wide
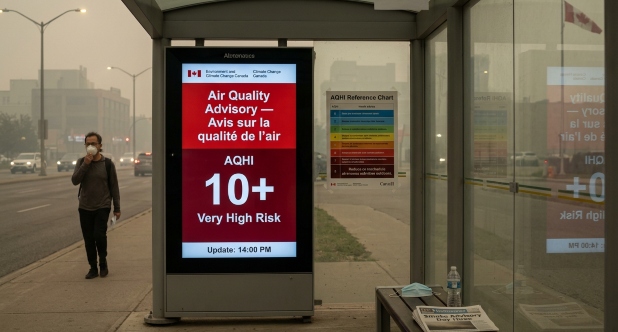
The AQHI rates the air on a scale from 1 to 10+, updated hourly with a daily forecast and plain-language advice for people who are sensitive to pollution. After the record smoke of 2023, ECCC added a red-banner Air Quality Advisory that fires when the index passes 10 for three or more hours during a smoke event.
● Active
Extreme heat
The 2021 heat dome exposed how thin the warning systems were for extreme heat. Provinces have since built dedicated response systems.
BC Heat Alert and Response System (HARS)
Run by the Province of British Columbia · Two-tier alerts · British Columbia
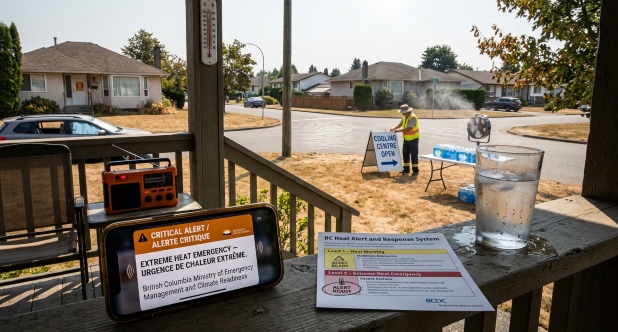
BC now separates a heat warning, which signals a moderate rise in risk, from an extreme heat emergency, which signals a severe one. The emergency tier triggers a direct phone alert through Alert Ready, closing the gap that proved fatal for many in 2021.
● Active
Flooding
Flooding is the odd one out. Canada has no single national real-time flood dashboard the way it does for wildfire, and most of the responsibility sits with the provinces.
Provincial flood forecasting
Run by provincial agencies · River forecasting · Province-specific
Alberta Rivers, the Ontario flood forecasting program, and similar provincial services publish water levels and flood outlooks for their own watersheds. Federally, Natural Resources Canada maintains a flood hazard mapping program aimed at long-term risk rather than live conditions. For a current threat, your provincial service plus the national alerts below are the practical combination.
● Active
National and multi-hazard
Some platforms cut across every hazard at once, either by pushing alerts or by holding the historical record.
Alert Ready (National Public Alerting System)
Run by Pelmorex, owner of The Weather Network · Public alerting · Country-wide
Alert Ready, the public face of the National Public Alerting System, has run since March 2015. It carries warnings for severe weather, wildfires, floods, AMBER Alerts, and civil and health emergencies straight to phones, television, and radio. By design, you cannot opt out of the wireless alerts.
● Active
Canadian Disaster Database
Run by Public Safety Canada · Historical record · Past century
This is a reference archive rather than a live feed. It documents more than 700 natural, technological, and conflict events that have affected Canadians over the past hundred years, with data on cost and impact. It is the place to go when you want to compare today’s crisis to past ones.
● Active
What happened to the COVID-era platforms
The pandemic produced its own generation of trackers. Most have gone quiet, which is the normal fate of a tool built for a single emergency. Here is where the main ones stand.
CityWatch Canada – Canadian Urban Institute
Run by the Canadian Urban Institute (Institut urbain du Canada) · Municipal dashboard · 65 cities
CityWatch Canada was built for tracking local government emergency measures across Canada. It provided real-time data on cities’ COVID-19 responses, covering closures, restrictions, financial supports, and other measures across 65 of the country’s largest municipalities. CUI staff and volunteers updated it daily as an interactive dashboard, which made it one of the few places to see how cities were reacting side by side. Like most pandemic-era trackers, it wound down once the emergency eased.
● Discontinued
CityShare Canada – Canadian Urban Institute
Run by the Canadian Urban Institute (Institut urbain du Canada) · Crowdsourced stories · Country-wide
CityShare fostered collaboration and knowledge exchange among experts and residents, and served as a hub for sharing best practices, innovative ideas, and success stories from communities across Canada. Rather than tracking official measures, it gathered the grassroots responses people were inventing on the ground. Its 2020 and 2021 collection still stands as a snapshot of that moment.
● Archived
City Tracker – Institute for Catastrophic Loss Reduction
Run by the Institute for Catastrophic Loss Reduction · City measures · Country-wide
City Tracker offered a comprehensive overview of measures implemented by Canadian cities, including physical distancing protocols, mask mandates, and business restrictions, with a focus on comparing strategies across places.
● Archived
COVID-19 City Response Monitor – Canadian Index of Wellbeing
Run by the Canadian Index of Wellbeing · Wellbeing lens · Country-wide
This monitor assessed measures related to health, social support, economic resilience, and community engagement, taking a broader wellbeing view than the operational dashboards.
● Archived
The official federal dashboard, run by the Public Health Agency of Canada, tracked roughly 4.65 million cases from the first one on 25 January 2020. It stopped updating on 4 October 2024 and merged into Canada’s broader respiratory virus surveillance report, where COVID now sits alongside influenza and RSV.
For reference, here is how the four municipal platforms compared. This table is kept in full from the original version of this guide.
Platform | Real-time data | Comparative analysis | Collaboration & exchange | Holistic assessment |
|---|---|---|---|---|
CityWatch Canada | Yes | Yes | No | No |
City Tracker | No | Yes | No | No |
CityShare Canada | No | No | Yes | No |
COVID-19 City Response Monitor | No | No | No | Yes |
The pandemic also drove home a point that still holds. Canadian municipalities hold the power to declare their own state of emergency, and they often act ahead of provincial or federal authorities. You can see the same local-first reflex today in how quickly towns order wildfire evacuations or open cooling centres during a heat wave.
What five years of crisis tracking taught us
Looking across these platforms, a few patterns stand out for anyone building one or relying on it.
The tools that lasted had a permanent home. CWFIS, the AQHI, and Alert Ready survived because they belong to standing agencies with a year-round mandate. The pandemic trackers, however good, were tied to one event and a volunteer push, and they faded once the urgency did.
Local information stays the hardest to find and the most useful. National maps tell you the shape of a crisis, but whether to leave your house is almost always a municipal or provincial call. That is exactly the layer the COVID dashboards tried to fill, and the layer that still has the thinnest coverage.
Alerts only help if people can act on them. The 2021 heat dome was not a failure of forecasting, since the heat was predicted. It was a failure of reaching the right people in time, which is why the newer systems push straight to phones and draw a clear line between a warning and an emergency.
Frequently asked questions
A COVID-era project of the Canadian Urban Institute that tracked how Canadian cities were responding to the pandemic, day by day. Like most pandemic-era trackers, it wound down once the emergency eased.
The Canadian Wildland Fire Information System (CWFIS) has a daily national map, and CIFFC publishes the season’s statistics.
Use the Air Quality Health Index on weather.gc.ca or the WeatherCan app. During heavy smoke, watch for the red-banner Air Quality Advisory.
The federal dashboard moved into Canada’s respiratory virus surveillance report in October 2024. Most municipal trackers were retired or archived.
Not a single real-time one. Flooding is handled mainly at the provincial level, with national warnings delivered through Alert Ready.
Alert Ready, the public face of the National Public Alerting System, is operated by Pelmorex and carries alerts from federal, provincial, and territorial authorities.
We’re an independent project that follows how Canada tracks and responds to emergencies. We’re not affiliated with CityWatch Canada or the Canadian Urban Institute, and we don’t speak for them.
Figures come from Statistics Canada, Natural Resources Canada, Environment and Climate Change Canada, the BC Coroners Service, Public Safety Canada, and the Public Health Agency of Canada. Platform statuses verified June 2026.